Although you might not have guessed it when you saw that fun graphic above, today’s post tackles one of the toughest subjects for the homeschool parent (drum roll please): …. high school math. I’m not simply talking about arithmetic or elementary number concepts but the real, nuts and bolts, algebraic and abstract concepts that constitute the middle and high school mathematics curricula.
According to the NCTM standards for school mathematics in grades 9 through 12, there is a significant emphasis on understanding the patterns of relations and functions requiring the homeschool student to “interpret representations of functions in two variables.” And if that last sentence doesn’t strike genuine fear in your heart, you are one very rare and brave home schooler!
For many homeschool parents, the weighty responsibility of choosing and implementing middle and high school math curricula is one of their most daunting challenges. In my career as a private math tutor, I’ve experienced frantic emergency calls from homeschooling parents who have hit that point in their child’s math studies when they have to bring in “the professional.” I’m always more than happy to oblige because the best part about working with the homeschool student is that I have flexibility when interpreting “representations of functions in two variables.” And I’m willing to share some of these interpretations with you today!
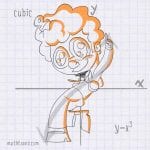
Remembering, recognizing and categorizing the graphs of various types of functions is a necessary skill for any high school math student. If you consider the number of graphs that any pre-calculus student should memorize, the list is intimidatingly long. In the middle grades, math students encounter their first two variable relationships and the straight line graph it creates, called a linear function (y=x). Shortly after this, students square their input variable (x) and examine the parabolic graph created by a quadratic function. Most of the names for our graph shapes are determined by the operation we place on our input variable so that when x is raised to the third power we call it a cubic function (which is joyfully illustrated in the graphic at the very beginning of this post). In my experience, students have fewer problems remembering the names of these functions and much more trouble remembering the shapes of their graphs. For instance, the graphs of exponential and logarithmic functions (drawn above and below), are common mix ups for pre-calculus students. The curves share similar traits (one avoids the x-axis, the other avoids the y-axis) which makes it difficult for math learners to remember which is which. And yet, accurately identifying exponential versus logarithmic shapes is an important skill in the calculus learner’s repertoire.
Luckily, these relationships between x and y are drawn in much the same way that the initial pencil strokes for illustrations are drawn: with very simple and fluid “lines of motion.” If we consider the curved movement of a graph as something similar to the direction of motion of, say, a cartoon character, then we have the basis for a very fun way to remember the shapes of various mathematical functions and relations.
So I asked my friend and colleague, Jessika von Innerebner, to lend her wonderful artistic skills to help students remember the shapes of graphs by superimposing some illustrations of funky dance moves onto the functions you see sketched here. If you are looking to create an interesting middle or high school math lesson that encourages the memorization of the shapes of various graphs, experiment with having your student draw his or her own illustrations onto the graph of a linear, quadratic, cubic, trigonometric, statistical or any other type of mathematical function or relation. After all, a sine curve becomes significantly more memorable when a sea serpent is sketched over top of its periodic wave motion!
This “math and art” lesson could lead to many more explorations concerning “the art of memory”. Students can discover some of the ways in which successful scientists and mathematicians use interesting visuals to help them remember the myriad facts and methods within their particular disciplines (called “mnemonics”). When we encourage students to create their own individual and unique ways to remember difficult subject matter, we help them understand that learning and remembering tough concepts can be truly enjoyable. Print out some function graphs, bring out the art supplies and encourage your student to create fun illustrations that can help with remembering various graph shapes. Everybody dance now!
Kristin Garn (aka “The Dreaded Supertutor”) is the director of Mathtoons Media, which is currently creating digital learning products designed to deliver fun ways to practice upper level math concepts like algebra, trig and calculus. For over 20 years, Kristin has taught math and science at the high school and university levels. She blogs at www.mathtoons.com and can also be followed on Twitter and Facebook.
19 Upstream is a Christian T-shirt company that goes a step further by including a high quality Bible reference card that ties into the theme of each shirt, and refers you to the related Bible study on their website. They also have a blog where they post about Bible reading, verses and even some stories…
We just finished our second year of homeschooling, and are currently on break, but we are only take a breather long enough to give me a chance to get my planning going. We are already bored. I wanted to share with you how I plan for the new school year, and hopefully, give you a…
Welcome to the Hip Homeschool Hop! Come on in and link up your blogs, facebook, & twitter pages ~ and be sure to “hop” on over to some of the hip homeschool moms linked up around you! We are so excited to be giving away two books from author and homeschool mom, Tricia…
It’s time for some Giveaway goodness!! Come on in ~ link up giveaways ~ click away and enter for great prizes! **If you are linking up a giveaway, be sure to first read our link-up guidelines HERE! *** PLEASE NOTE *** Giveaway sites that do not link back to Hip Homeschool Moms in some…
Welcome to another week of fabulous giveaways hosted here at Hip Homeschool Moms! Link up your giveaways Homeschool Moms would love to enter! If you are linking up a giveaway, be sure to first read our link-up guidelines HERE! *** PLEASE NOTE *** Giveaway sites that do not link back to Hip Homeschool Moms in some way…
We are participating in Apologia LIVE’s “Meet & Greet” event today and are honored to feature our interview with homeschool mom and author, Sally Clarkson. The Giveaway. And if that wasn’t awesome enough…. anyone who leaves a comment on this post between now and the end of the day on Friday 8/26/11 will automatically be…
2 Comments
This is one of the best ideas I’ve seen. My 9th grader loves to doodle so now she can doodle with a purpose. Thank you.

 Remembering, recognizing and categorizing the graphs of various types of functions is a necessary skill for any high school math student. If you consider the number of graphs that any pre-calculus student should memorize, the list is intimidatingly long. In the middle grades, math students encounter their first two variable relationships and the straight line graph it creates, called a linear function (y=x). Shortly after this, students square their input variable (x) and examine the parabolic graph created by a quadratic function. Most of the names for our graph shapes are determined by the operation we place on our input variable so that when x is raised to the third power we call it a cubic function (which is joyfully illustrated in the graphic at the very beginning of this post). In my experience, students have fewer problems remembering the names of these functions and much more trouble remembering the shapes of their graphs. For instance, the graphs of exponential and logarithmic functions (drawn above and below), are common mix ups for pre-calculus students. The curves share similar traits (one avoids the x-axis, the other avoids the y-axis) which makes it difficult for math learners to remember which is which. And yet, accurately identifying exponential versus logarithmic shapes is an important skill in the calculus learner’s repertoire.


This is one of the best ideas I’ve seen. My 9th grader loves to doodle so now she can doodle with a purpose. Thank you.
Kathryn, we’re glad this article helped you! I have a 10th grader, and I think this will be good for him too.